Data Management
IMPORTANT: Only users assigned to the Preparer access group can complete the following tasks on the Home page.
To enter data for a profile, select the profile from the grid and click the Manage button.
Administrators have the option to complete or revert a workflow using the Complete Workflow and Revert Workflow buttons. If the workflow is locked or completed, no data can be entered for that profile. If something is updated, like a factor or definition, the data will only update in open workflows while all data in locked or completed workflows remains the same.
Carbon Calculations
To run carbon calculations for emissions factors, click the Calculate button. This button runs carbon calculations for the year and scenario selected in the Workflow POV and displays the results on a new page. The page displays header tiles that show the CO2e, CO2, CH4, and N2O totals. Only OneStream and Solution Administrators can run calculations.

Data Entry
There are three tabs for data entry: Definitions, Emissions, and Utilities. Navigate to the following topics for the data entry process. To download a data entry template and import your data for definitions, emissions, and utilities, see Data Import.
NOTE: If a user is in the access group for a site, but not in the access group for the profile that site is assigned to, the profile will still display in the grid. They can enter data in the Emissions and Utilities tabs, but the Definitions tab will not display data.
Definition Data Entry
This tab displays a grid of all definitions assigned to the profile that require either a narrative or value entry. The entity assigned to the profile displays above the definitions grid.

To enter data for a definition, complete the following steps:
-
Select a definition from the grid.
-
Click the New button to add an entry.
-
Enter all data for the definition in the slide-out.
-
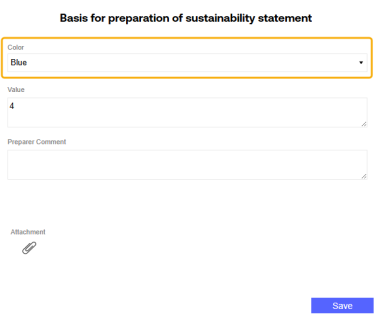
If one or more control lists are assigned to the definition, there will be drop-down menus with the titles of the control lists. Make control list member selections from the available drop-down menus to enter data for that selection. See Control Lists.
Control list drop-down menus do not display if none are assigned to the definition. You must create a new entry for every control list member you are entering data for.
-
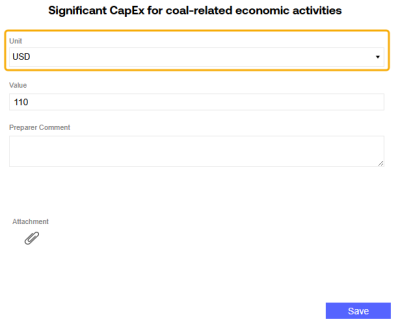
If the definition unit type requires a unit selection, from the Unit drop-down menu, select a unit. If the definition unit type does not require a unit selection, the Unit drop-down menu does not display.
NOTE: The following definition unit types require a unit selection: area, data, distance, energy, time, volume, weight, and monetary.
-
In the Value field, enter a value for the entry. You cannot enter a numeric value exceeding 7.9228 x 1028.
For definitions with a Narrative unit type, this field displays as a text box. The text box supports line breaking.
NOTE: If there are multiple narrative entries for a definition, the most recent entry will be used in the report. This is regardless of the workflow period the narrative is entered for.
-
Add an attachment or Preparer comment if required. If an attachment or comment is required for the definition, the entry cannot be saved until an attachment or comment is added. See Attachments and Comments.
-
-
When you finish entering data for the definition, click the Save button.
NOTE: If there are multiple entries for the same definition, the most recent entry will be used in the report.
If the definition you are entering data for has the Baseline, Prior Year, or Milestones options selected on the Definitions page, the entry grid has additional columns to display data.

| Column | Description |
|---|---|
| Baseline | Users must enter their baseline year, prior year, and target year data on the Home page in the Workflow Profile for the appropriate year and scenario. The columns populate based on this data entry. If there is no data provided for the baseline year, prior year, or milestone scenarios selected in Global Options, the corresponding columns will be blank. |
| Prior | |
|
Target |
|
| N | This column displays the value for the current year. |
| N-(N-1) | This column displays the variance between the Current year (N) and the Prior year (N-1). |
| % N/(N-1) | This column displays the percent change between the Current year (N) and the Prior year (N-1). |
Emission Data Entry
This tab displays a grid of factors and a grid of each entry made for that factor.
To display data on the Emissions page, from the Site drop-down menu, select a site. From the Factor Group drop-down menu, select a factor group or select (All). All factors within that selection display in the grid. Once you select a site, the country and state/city assigned to the site will display above the grid.

To enter data for factors, complete the following steps:
-
Select a factor from the grid and then click the New button to add an entry for that factor.
-
Enter all emissions data in the slide-out.
-
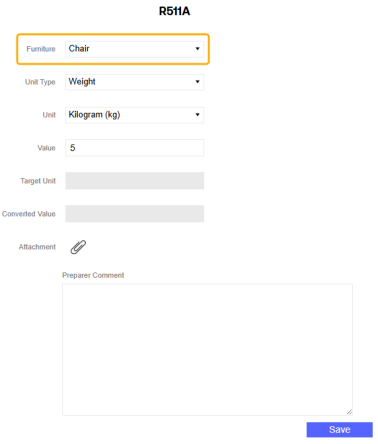
If a control list is assigned to the factor, there will be a drop-down menu with the title of the control list. Select a control list member from the drop-down menu to enter data for that member. See Control Lists.
This drop-down menu does not display if no control list is assigned. You must create a new entry for every control list member you are entering data for.
-
The Unit Type drop-down menu defaults to the unit type assigned to that factor. You can use the Unit Type drop-down menu to select a different unit type if needed. Only valid unit types for that factor are displayed.
-
From the Unit drop-down menu, select a unit. Only valid units for that unit type are displayed
-
In the Value field, enter a value for the factor entry. You cannot enter a numeric value exceeding 1019-1. Converted values also cannot exceed this number.
-
Add an attachment or Preparer comment if required. If an attachment or comment is required for the factor, the entry cannot be saved until an attachment or comment is added. See Attachments and Comments.
NOTE: The Target Unit and Converted Value fields cannot be edited. Once you save the entry, these values will display in the corresponding column grids.
-
-
Click the Save button.
For factors that require multiple inputs, for example AreaOverTime, two Unit Type and Unit drop-down menus display for selection, and two Value fields display for data entry.
Utility Data Entry
This tab displays a grid with the two utilities supported for data entry: Electricity and Heat and Steam. To display data on the Utilities page, from the Sites drop-down menu, select a site. The two utilities display in the grid. If the site is only assigned one utility, that single utility displays in the grid. If no utilities are assigned to the site, the grid is blank. See Sites. Once you select a site, the country and state/city assigned to the site display above the grid.
If a supplier has been changed on the Sites page, Preparers can enter and update data for both suppliers if they did not migrate all data to the new supplier.
To enter data for utilities, complete the following steps:
-
Select a utility from the grid and then click the New button to add an entry for that utility.
-
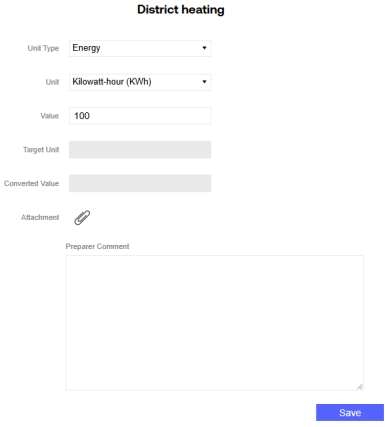
Enter all utility data in the slide-out.
-
The Unit Type drop-down menu defaults to Energy. No selection is needed.
-
From the Unit drop-down menu, select a unit.
-
In the Value field, enter your value for the utility. The value must be numeric. You cannot enter a value exceeding 1019-1. Converted values also cannot exceed this number
NOTE: The Target Unit and Converted Value fields cannot be edited. Once you save the entry, these values will display in the corresponding column grids.
-
Add an attachment or Preparer comment if needed. If an attachment or comment is required, the entry cannot be saved until an attachment or comment is added. See Attachments and Comments..
-
Click the Save button.
Delete a Data Entry
 To delete an entry from the grid in the Definitions, Emissions, or Utilities tabs, click the Delete button.
Use the checkboxes to multi-select entries to delete. Preparers can only delete entries that they created. If a Preparer multi-selects entries to delete and did not create all entries selected, only the entries they created are deleted. Only Solution Administrators can delete entries they did not create.
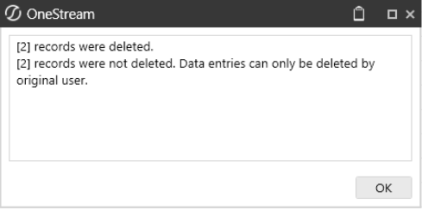
NOTE: Entries can only be deleted if the profile is in the In Process status.
Attachments and Comments
![]() Use the Attachment icon to add, delete, and view attachments.
Use the Attachment icon to add, delete, and view attachments.
![]()
-
To add an attachment, click the Add button.
-
To delete an attachment, click the Delete button.
NOTE: Attachments can only be deleted by the one who uploaded the attachment.
-
To view an attachment, click the View button.
To add an attachment, complete the following steps:
-
Navigate to either the Definitions tab, the Emissions tab, or the Utilities tab.
-
Select an entry from the bottom grid and click the Edit button, or create a new entry.
-
Click the Attachment button to display the Attachments slide-out.
-
Click the Add button
-
In the File Upload window, click the BROWSE button to open File Explorer.
-
Select the file and click the Open button.
-
Click the Upload button. The attachment is displayed in the grid.
-
Click the Close button.
-
-
Click the Save button.
NOTE: If an attachment is required, you cannot save the entry until an attachment is uploaded.
Manage Comments
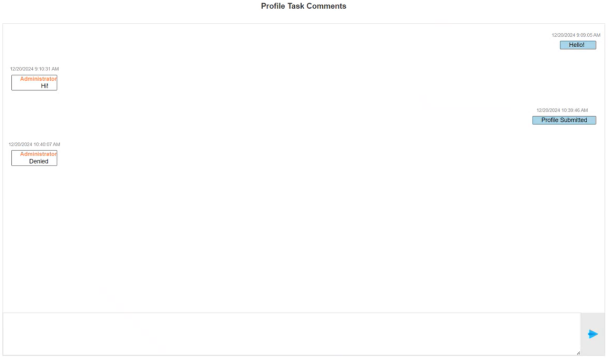
![]() Use the Comments icon to enter profile level comments. All comments entered and saved will display in the Profile Task Comments slide-out on each data entry tab. Users can add comments and reply to comments saved by other users.
Use the Comments icon to enter profile level comments. All comments entered and saved will display in the Profile Task Comments slide-out on each data entry tab. Users can add comments and reply to comments saved by other users.
To add a comment, click the Comments button to display the Profile Task Comments slide-out. Enter a comment in the text box and then click the Send button. The comment will display in the chat. Each message will display the user who sent the comment and the date and time the comment was sent.
